January's online grocery sales inch up over last year
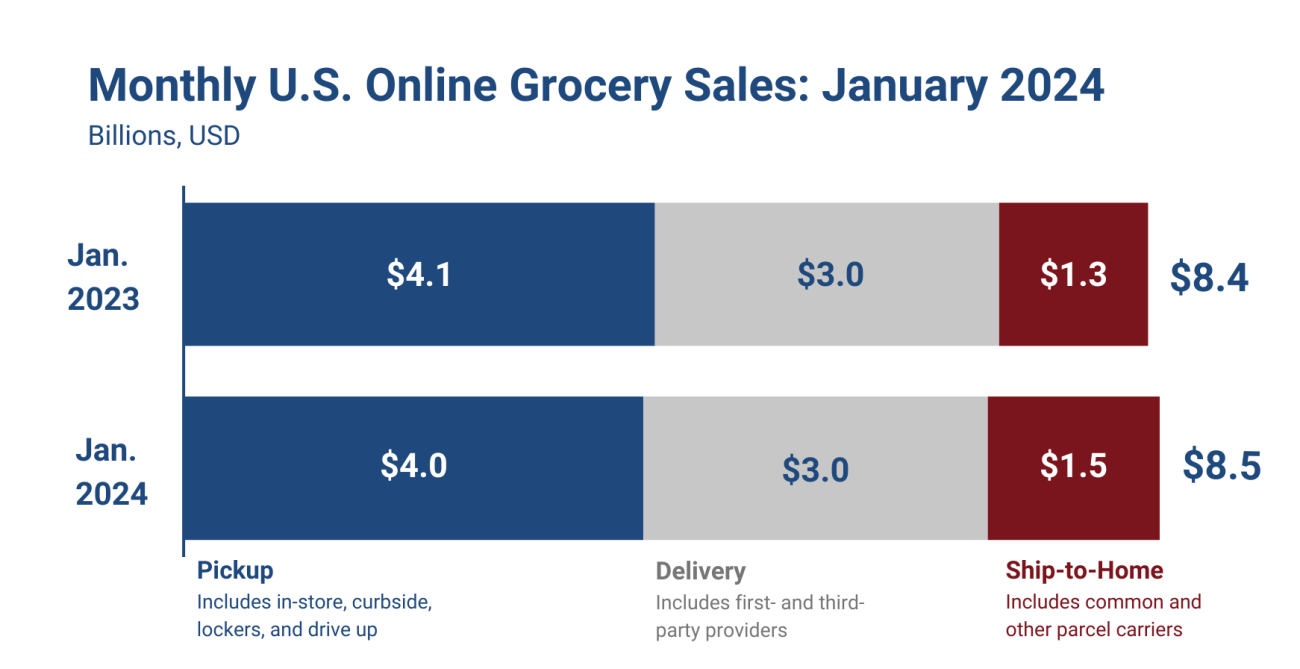
Online grocery sales in the U.S. rose to $8.5 billion in January, a slight increase from one year ago.
According to the most recent Brick Meets Click/Mercatus Grocery Shopper Survey fielded Jan. 30-31, sales rose 1.8% year-over-year. Despite an increase in the total number of households buying groceries online during the month, January’s overall sales growth was moderated by a decrease in order frequency and a composite average order value (AOV) that was roughly flat compared to the prior year. In 2023, total online grocery sales totaled $95.8 billion in 2023, down 2% from the previous year and 1.8% on a two-year stack.
The ship-to-home was the only segment to grow year-over-year as sales climbed to $1.5 billion during the month, up 7.8% compared to January 2023. Higher order volume, driven by an increase of monthly active users (MAUs) and a more than 7% increase in AOV, helped the segment capture 224 additional basis points (bps), to end the month with 17.4% of total e-commerce sales.
January’s delivery sales of $3.0 billion decreased slightly, down 0.5% versus 2023, as the 3% growth in its AOV could not offset the larger decline in order volume. While the delivery MAU base grew slightly, the gain was eclipsed by the decline in order frequency among MAUs. As a result, delivery’s share of January’s online grocery sales slipped 82 bps to 35.3% for the month.
Pickup remained the most popular online grocery option, but its sales fell 1.9% to $4.0 billion for January, which Brick Meets Click credits to lower order frequency by MAUs and a 1.8% decrease in AOV, despite moderate growth to its MAU base. Pickup finished the month with 47.3% of online sales, down 142 bps versus January 2023.
“When more than 10% of U.S. households have less money to spend on groceries this year than they did last year, changes in buying behavior are certainly expected,” said David Bishop, partner at Brick Meets Click. “The reduction in SNAP payments that took effect at the end of February 2023 is one of the factors driving the flight-to-value trend which we’ve observed and tracked since mid-2023.”
The mass format, led by Walmart, continued to excel in the broader market, expanding its MAU base by almost 10% while it also posted a strong uptick in AOVs. The growth in its MAU base more than compensated for flat year-over-year order frequency among its active customers.
The number of supermarket MAUs shrank by more than 5% in January. The average number of orders completed by MAUs during the month fell by a larger rate, and the average dollars spent per order decreased slightly.
Cross-shopping between mass and grocery (which includes supermarket and hard discount) decreased slightly in January versus the prior year. Although Walmart’s rate climbed over 300 bps versus a year ago, the overall decrease resulted from a decline in cross-shopping among other mass retailers.
Last month roughly 30% of households that bought groceries online from a grocery store also purchased groceries online using a mass retailer’s shopping service. Brick Meets Click says that cross-shopping rates between grocery and mass remain nearly twice as high as before the onset of the pandemic.
Online sales across all formats accounted for 13.4% of total weekly grocery spending during the last week of January, increasing 120 bps versus last year. The combined contribution of pickup and delivery, since most conventional supermarkets do not offer ship-to-home, also grew 72 bps to finish the month at 11.1%.
The Bricks Meets Click/Mercatus Grocery Shopper Survey is an ongoing independent research initiative created and conducted by Brick Meets Click and sponsored by Mercatus. Results were adjusted based on internet usage among U.S. adults to account for the non-response bias associated with online surveys. Responses are geographically representative of the U.S. and weighted by age to reflect the national population of adults, 18 years and older, according to the U.S. Census Bureau.


